
Valaris (VAL) - Multibagger Upside at 16 Cents on a Dollar
Playing the Next Offshore Drilling Cycle with Extreme Downside Protection


Summary:
Valaris is the world's largest offshore drilling contractor by fleet size, servicing major energy companies such as Chevron, BP, Shell, Petrobras, Equinor, and Exxon. The company owns 53 vessels, which include 18 floaters (deep-water units) and 35 jackups (shallow-water units). The former can be further divided into 13 drillships and 5 semisubmersibles.
The offshore industry has faced a decade-long bear market that led to the bankruptcy of many operators, including Valaris. This decline was primarily driven by increasing competition from shale (fracking) and the Deepwater Horizon accident, which tarnished the industry’s reputation.
However, with their debt wiped out years ago, new, better management, significant share buybacks, and a growing competitive edge over shale, Valaris is becoming increasingly attractive. This is especially true given the strong industry tailwinds and downside protection from lower dependency on high oil prices, as well as the fact that the company's asset value is a few times greater than its market cap and EV.
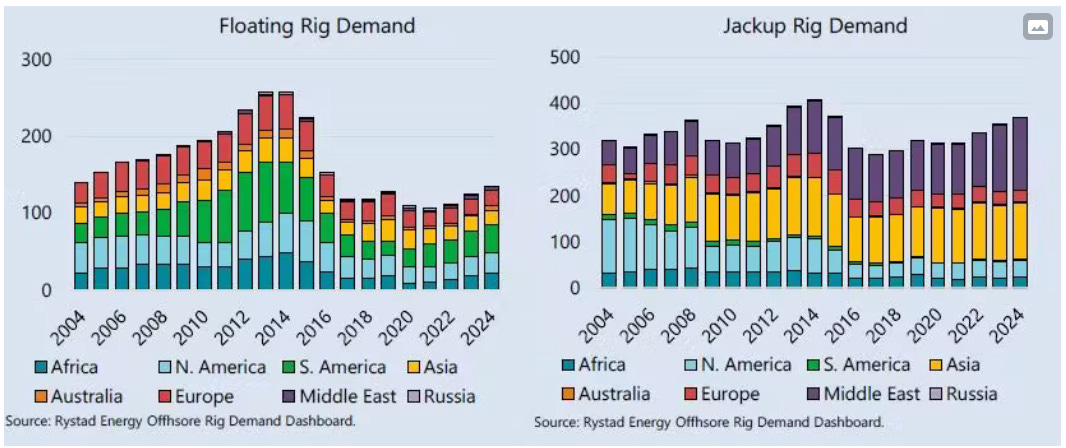
In the last decade, the global offshore fleet has decreased from approximately 300 to around 150 vessels. Excluding ships that have been out of service for an extended period, the effective operational fleet may now be estimated at as low as 120-130 units.
Despite a 2-3x increase in drilling volume per ship due to technological improvements, the 50-60% reduction in fleet size significantly limits supply. Vessels still need to navigate across oceans to reach drilling sites, and their operations are becoming more concentrated, which restricts overall flexibility.
Thanks to technological advancements, the global offshore breakevens are now around $40/bbl, which is $10-20 lower than most alternatives, except for the Persian Gulf onshore projects. In the United States, this disparity is even bigger, as shale, which constitutes two-thirds of U.S. output, operates at approximately $60/bbl, while most legacy sources function in the mid-$60s/bbl.
Offshore projects currently offer internal rates of return (IRRs) that are roughly 40-80% higher than traditional onshore and shale alternatives. Consequently, greenfield investments in offshore projects are now approximately 50% higher than onshore.
Since 2022, day rates for drillships have surged from about $250k to $500k — an impressive 100% increase over two years. Day rates for benign environment jackups rose from roughly $90k to $170k and for harsh environment jackups from about $100k to $140k, representing increases of approximately 90% and 40%, respectively.
During the last cycle, day rates peaked at about $800k for drillships and between $225k and $275k for jackups. We believe that in the current cycle, we could see day rates reach approximately $900k for floaters (drillships and semisubmersibles) and $275k for jackups.
Replacing offshore fleets is challenging, with shipbuilding times ranging from 2 to 4 years, depending on the vessel type. Given the strong industry tailwinds, Valaris's assets are becoming even more appealing. The current replacement value is ~6x to ~8x larger than the enterprise value (EV) and market capitalization, respectively, which means that Valaris effectively trades at 16 cents on the dollar based on EV. When considering this discount and lower crude oil prices needed for offshore viability, we believe Valaris offers significant downside protection.
The company is currently trading at an attractive P/FCFF of 10x for 2025E and 4x for 2026E. Its EV/EBITDA ratios for the same years are approximately 5x and 3x, respectively. Valaris also has a buyback yield of 5%, and great investors like John Fredriksen and Harris Kupperman have been purchasing the stock, with many others building positions in the broader industry, as well.
Due to the extreme cyclicality of Valaris, we prefer to value the business using net asset value (NAV) to EV. By applying a peak cycle multiple of 1.5x and estimating the fleet value at a 30% discount to replacement value, we estimate the company's target EV at $27 billion, implying a potential upside of ~7x. Downside and Upside cases with 1.25x and 1.75x multiples imply a potential upside of 5x and 9x, respectively.
Download Our Model

Before we begin I would like to thank Value Degen and Deepwater Insights for inspiring this deep dive on Valaris. Through their work, we discovered this incredible industry and the companty itself. These are wonderful creators that have been sharing their views on offshore for some time. Give them a follow! It’s worth it.
Business Overview
Valaris is the world's largest offshore driller by fleet size, operating a total of 53 vessels. The company provides exploration and production (E&P) services to global energy leaders such as BP, Shell, Chevron, Petrobras, and Exxon. These majors contract Valaris' fleet to conduct work on the ocean floor in offshore oil-rich regions, including the Gulf of Mexico, Persian Gulf, North Sea, and Gulf of Guinea.

Valaris owns 35 jackups - self-lifting platforms designed for shallow-water operations, which can reach depths of up to 500 feet. Additionally, the company has 18 floaters, ideal for deep-water drilling. These consist of 5 semi-submersibles and, their crown jewel, 13 drillships. While semi-submersibles are better suited for longer-term exploration, they are less mobile. In contrast, drillships are entirely self-dependent and do not require barges for towing, offering greater operational flexibility.
Although jackups are more numerous, they are less profitable. According to Deepwater insight, only ~35% of mid-cycle EBITDA comes from jackups, whereas floaters contribute ~66% in total (55% from drillships and 11% from semi-submersibles).
Closer Look At the Fleet
Valaris owns 35 jackups (33 modern and 2 legacy). It leases 9 of them to ARO, a joint venture with Saudi Aramco in which it holds a 50% stake. This whole fleet can be divided into two main subcategories: 12 harsh environments (HE) and 23 benign environments (BE) units. Currently, 10 out of the 12 HEs are operational and located in the North Sea (excluding Norway), where Valaris controls ~60% of the market. The remaining 2 HE units are stacked and awaiting activation.
Out of the 23 benign environment units, 13 are active. These units are deployed globally, with the majority situated in the Middle East, (22% market share in Saudi Arabia and 19% in the rest of the Persian Gulf).
Shell, Harbour Energy, and BP are the top clients in this segment, holding backlog shares of 23%, 15%, and 13%, respectively.

In terms of floaters, Valaris owns 18, which are divided into 13 drillships and 5 bengin environment semi-submersibles. Floaters are usually much larger, more versatile, and capable of deeper drilling compared to jack-ups, with drillships operating in depths of 10,000 to 12,000 ft and semi-submersibles between 6,000 to 10,000 ft. The key difference is that semi-submersibles must be towed to the operational site and have lower speed and flexibility. On the upside, their design makes them well-suited for stationary exploration.
Currently, 10 out of the 13 drillships are operational, primarily working in the Golden Triangle region, which includes Guyana and Suriname (28% market share), West Africa (16% market share), and the Gulf of Mexico (19% market share). The main clients in this segment are Petrobras, Equinox, and Azule Energy, with backlog shares of 33%, 25%, and 12%, respectively.
In terms of semisubmersibles, 3 out of 5 are active, with 2 operating in Gulf of Mexico and 1 in Australia.

Areas such as Canada and Norway, which feature deeper waters and harsher conditions — including frequent storms and high waves — are beyond the operational reach of jack-ups, benign-condition semi-submersibles, and lighter drillships. Transocean (RIG) and Odfjell are the two main players in this niche market with the first controlling most of it.
Driller Dilemma
We faced a real dilemma when selecting our offshore driller to write about. Ultimately, it came down to two great companies: Transocean (RIG) and Valaris (VAL). Both are cheaper than their competitors (when looking at underlying assets) and are sizable enough to benefit from the economies of scale and consolidation present in this industry.
Transocean has a more modern fleet, with most of it composed of high spec 7th generation (7G) or even the first 8G drillships and large semisubmersibles. Its fleet is well suited for harsh conditions where It is a dominant player. This allows Transocean to enjoy the highest utilization rates and build up a strong backlog.
On the other hand, jack-ups segments is more more competitive, leading to narrower profit margins. Many players are slowly shifting towards semisubs and drillships selling or scraping their jacklup fleets. So, given Transocean's advantageous market position and assets, why wouldn’t we choose it?
Debt and Buyback Problem
Firstly, RIG is struggling with significant debt. The company owes approximately $7bn, which when adjusted for cash results in a net debt of ~$6.5bn. With a Last Twelve Months (LTM) EBITDA of $0.9bn, this translates to a high ND/EBITDA ratio of around 7.2x.
Even if EBITDA were to double or triple, RIG's ND/EBITDA would still be at 3.6x and 2.4x, respectively. Because of this, it would take a considerable amount of time for Transocean to initiate share buybacks or dividends. In contrast, VAL has an LTM ND/EBITDA of 2.0x and has been actively buying back shares since 2021, reducing its share count by approximately 5%. The company continues this practice with a current buyback yield of ~5%. With growing EBITDA and cash flow this offshore cycle the company could significantly increase its capital distribution to shareholders.
Without delving too deeply into specifics, Valaris is also slightly cheaper when considering the asset value (replacement and present values). To our knowledge, it also has a more competent management team that prioritizes shareholder returns (i.e. buybacks), as evidenced by its share price performance over the last five years.
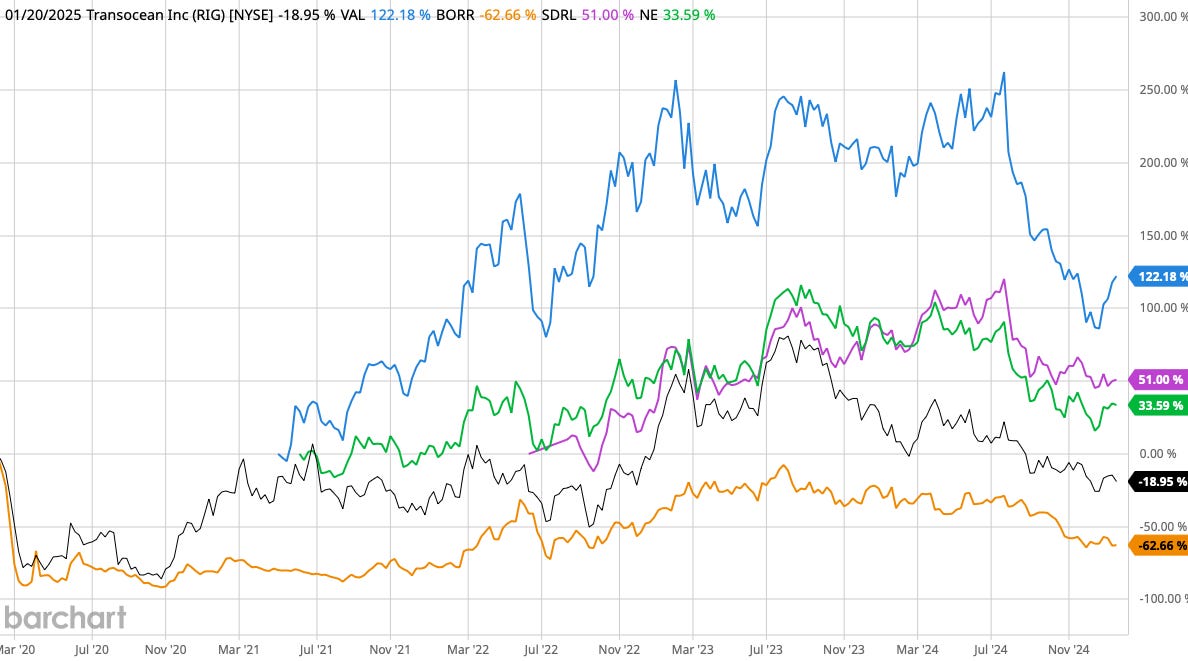
Share performance of offshore drillers
Seadrill Acquisition
Lastly, there have been rumors for several months about a potential acquisition of Seadrill. Initially, it was unclear who the acquirer would be, but recent reports from Bloomberg and Reuters indicate that Transocean is in talks with Seadrill’s management.
Before these news, we would say It was 60%-40% probability of Trasnocean and Valaris being a buyer. However, at this point most evidence points to Transocean. The industry is trading at a steep disocunt to its assets so any acquisition would likely have to occur at a premium to the share price. Seadrill is no exception. Given that RIG lacks sufficient cash and cannot increase its debt too much, it would likely have to rely on stock that is currently trading very poorly.
As a result, It most likely will be a stock deal, very dilutive stock deal for Transocean shareholders. Value Degen has written a great article about this topic, and we recommend visiting his blog to get a better grasp of the situation. He estimates that a 15% premium for Seadrill could lead to a 47% dilution for Transocean shareholders (Ouch). Therefore, we prefer to pass on this possibility and opt for Valaris as a safer exposure to offshore tailwinds we discuss in the next section.
Offshore Drilling Macro
The Oil & Gas (O&G) industry is highly cyclical, influenced by the demand and supply balance of crude oil and natural gas. However, exploration and production services (E&P) such as offshore are like O&G on leverege with cycles of its own.
Among the various types of E&P services and drilling, the most critical for our thesis are shale, conventional, deepwater, and shelf (shallow) drilling. The first two refer to onshore operations, while the latter two to offshore.
Before 2010, at the onset of the fracking revolution, offshore production accounted for 30% of the U.S. oil supply and 31% of the global supply. It was also responsible for 20-25% of worldwide natural gas supply and 10-15% in the U.S. However, the introduction of fracking technology significantly lowered onshore breakeven costs, enabling shale production to take market share away from offshore drillers and conventional drilling.
This advancement allowed the U.S. to surpass Saudi Arabia in oil production and gain a substantial lead over Russia in natural gas production, with shale now accounting for ~2/3 of U.S. oil and gas production.


While shale was beginning to rise, the Deepwater Horizon accident in 2014 acted as a pivotal event, ultimately affecting the entire offshore industry. This catastrophic disaster resulted in the loss of 11 dead and 17 injured, along with an estimated oil spill of 3.2mm barrels. Coinciding with the rising Environmental, Social, and Governance (ESG) movement, the incident severely tarnished the image and credibility of offshore drillers, diverting investment towards shale.
The number of offshore vessels decreased from nearly 300 to around 150 today. The actual operational capacity could be even lower, as many units have been cold-stacked for extended periods, leading to rust and the degradation of unused equipment. We estimate that the effective global fleet count could be as low as 120-130 units.
Offshore Back in Favor
You may be wondering: if shale is so dominant, why invest in a declining industry like offshore? The truth is, It is not dying anymore, and many things have changed since 2014. We believe investments will be increasingly shifting back towards this sector. This trend is already underway, as most low-cost shale fields have either been developed or are planned for the upcoming few years. Consequently, the value proposition for shale is no longer as attractive but we will delve into the unit economics later.
Offshore drillers have been active, leading to significant changes in the industry, including lower breakeven points and improved returns. New methodologies and technological advancements allow the most advanced ships to drill 2-3x more wells than they did in 2010. From the changes implemented, it seems the most significant impact came from:
Floating Production Storage and Offloading (FPSO) systems. In the past, laying undersea pipelines, which involved high installation costs (such as underwater welding), created a sunk cost in case production ceased. With FPSO vessels, the infrastructure can be largely reused. FPSOs allow oil to be temporarily stored until a transfer tanker can transport it onshore,
blowout preventers are now installed on ships, significantly reducing the risk of accidents like the Deepwater Horizon explosion. When there are two or more installed, It enables drillers to use Managed Pressure Drilling (MPD), which speeds up the drilling process and allows for more precision,
further advancements in seismic and electromagnetic surveys have allowed for better mapping and more precise drilling. Artificial intelligence is beginning to assist in exploration and production phases, improving the likelihood of hitting crude reservoirs sooner and enhancing production efficiency,
drilling automation has led to headcount reductions and a more streamlined drilling process,

Moreover, the narrative of peak oil demand prophecized for 2020s or 2030s, has largely been debunked. Many forecasts, even from International Energy Agency (IEA), have been proven to include incorrect assumptions, such as underestimating consumption from the emerging middle class in Latin America, Asia, and Africa, as well as energy demand from new technologies like AI. That’s why we believe O&G will continue to play an important role in the economy. We think, this paradigm shift is especially impacful in offshore due to by years of supply reduction (less drillships).
Improving Economics
The financial metrics we’re about to discuss vary widely depending on specific projects and data sources. In some cases, breakevens can swing as much as 35% above or below the average due to project characteristics. Thus, even if one technology currently appears superior on average, it doesn't necessarily mean that the entire method will be obsolete.
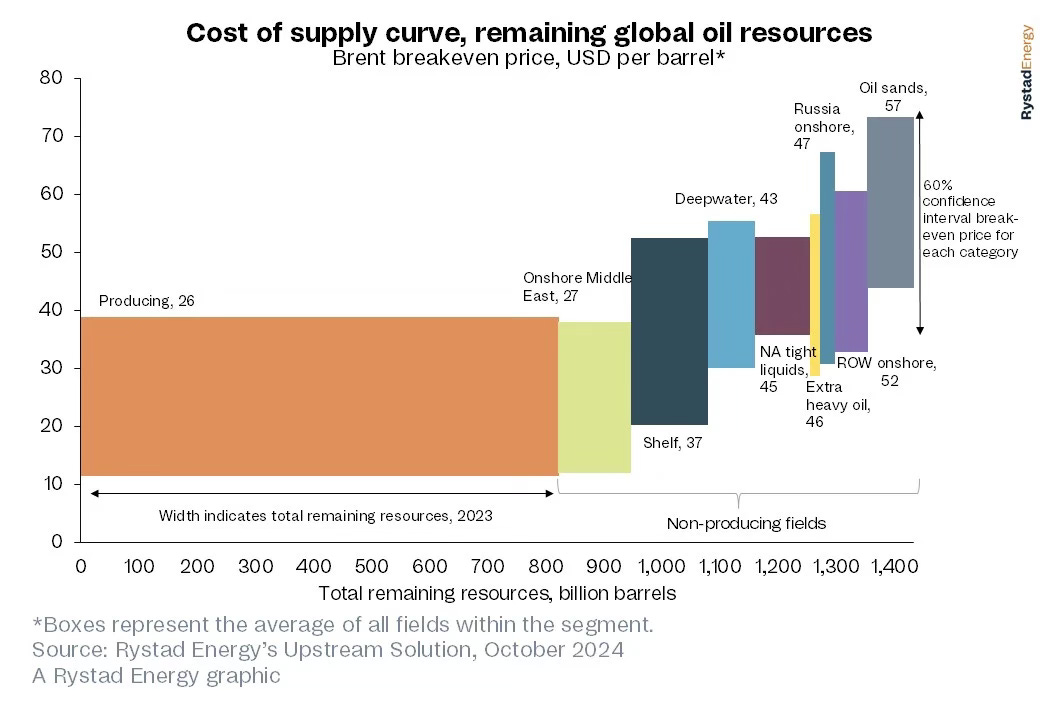
Diving into specifics, both shelf and deepwater drilling costs have dropped ~40% since 2014, now standing at around $37/bbl and $43/bbl, respectively. Meanwhile, global shale (often called tight oil) breakevens has also dropped to ~$45/bbl.
Normal onshore production from the Middle East remains the least expensive option, but the gap to offshore has largely narrowed. When factoring in shipping costs—especially to locations far from the Middle East — offshore production becomes newar the same or even cheaper. Additionally, Middle Eastern shelf drilling costs are even lower than the global average, making it worthwhile depending on the project (the best example is ARO).
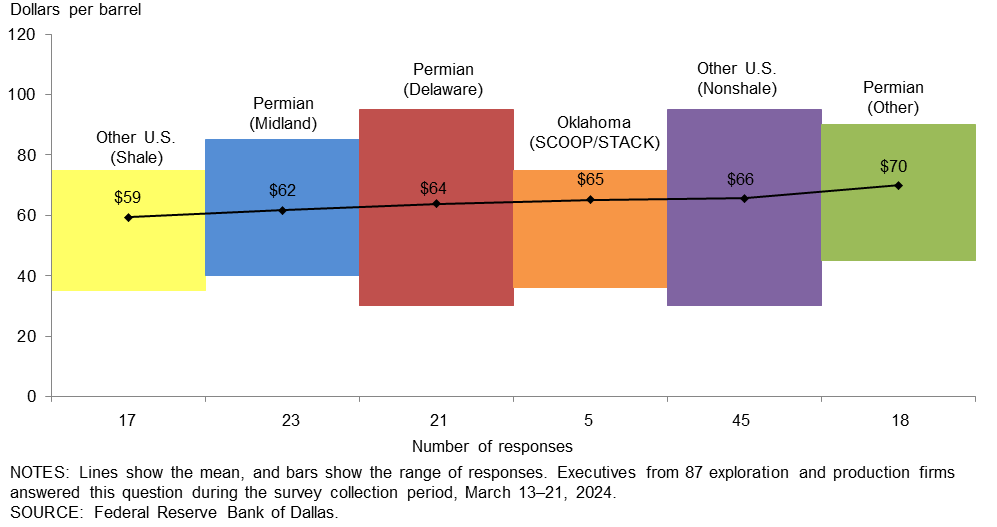
When we look at the United States, the gap between breakevens only grow. Shale, which accounts for roughly 64% of U.S. production, operates at around $60/bbl. Other onshore sources function in the mid-$60s/bbl, reaching as high as $70/bbl. Such fields are only turning a marginal profit at the current West Texas Intermediate (WTI) price of $72/bbl.
United States Onshore Breakevens
Due to lower breakevens, we believe that offshore production not only is now nore competetive but It also offers better protection from crude oil price fluctuations.
Brent crude has been trading in a range of $70-90/bbl for the last since 2023. If prices were to drop below $70/bbl, driulling day rates might decline, but we believe the impact would be minimal. Only about 9% and 16% of P50 reserves (with a 50% probability of hitting oil) have breakevens at or above $70/bbl and $60/bbl, respectively. With that dropp the bulk of projects would still be highly profitable, with the most having breakevens in the $20-50/bbl range.

Not Only Better Breakeven…
Breakevens are not the only metric to consider. There are additional reasons for an offshore resurgence, including much higher internal rates of return (IRR). Offshore deepwater and shelf projects offer IRRs that are approximately 40% and 80% higher than those of onshore traditional and shale drilling alternatives. The main factors contributing to this include higher production rates — allowing faster and greater revenue generation — and lower maintenance costs, as FPSOs can operate fields once drilled.
The main drawback of offshore drilling remains the high upfront costs, which posed challenges in the past. However, as the O&G sector has consolidated over the past 20 years, offshore drilling is now positioned to be even more attractive to major companies like Shell, Chevron, BP, and others.
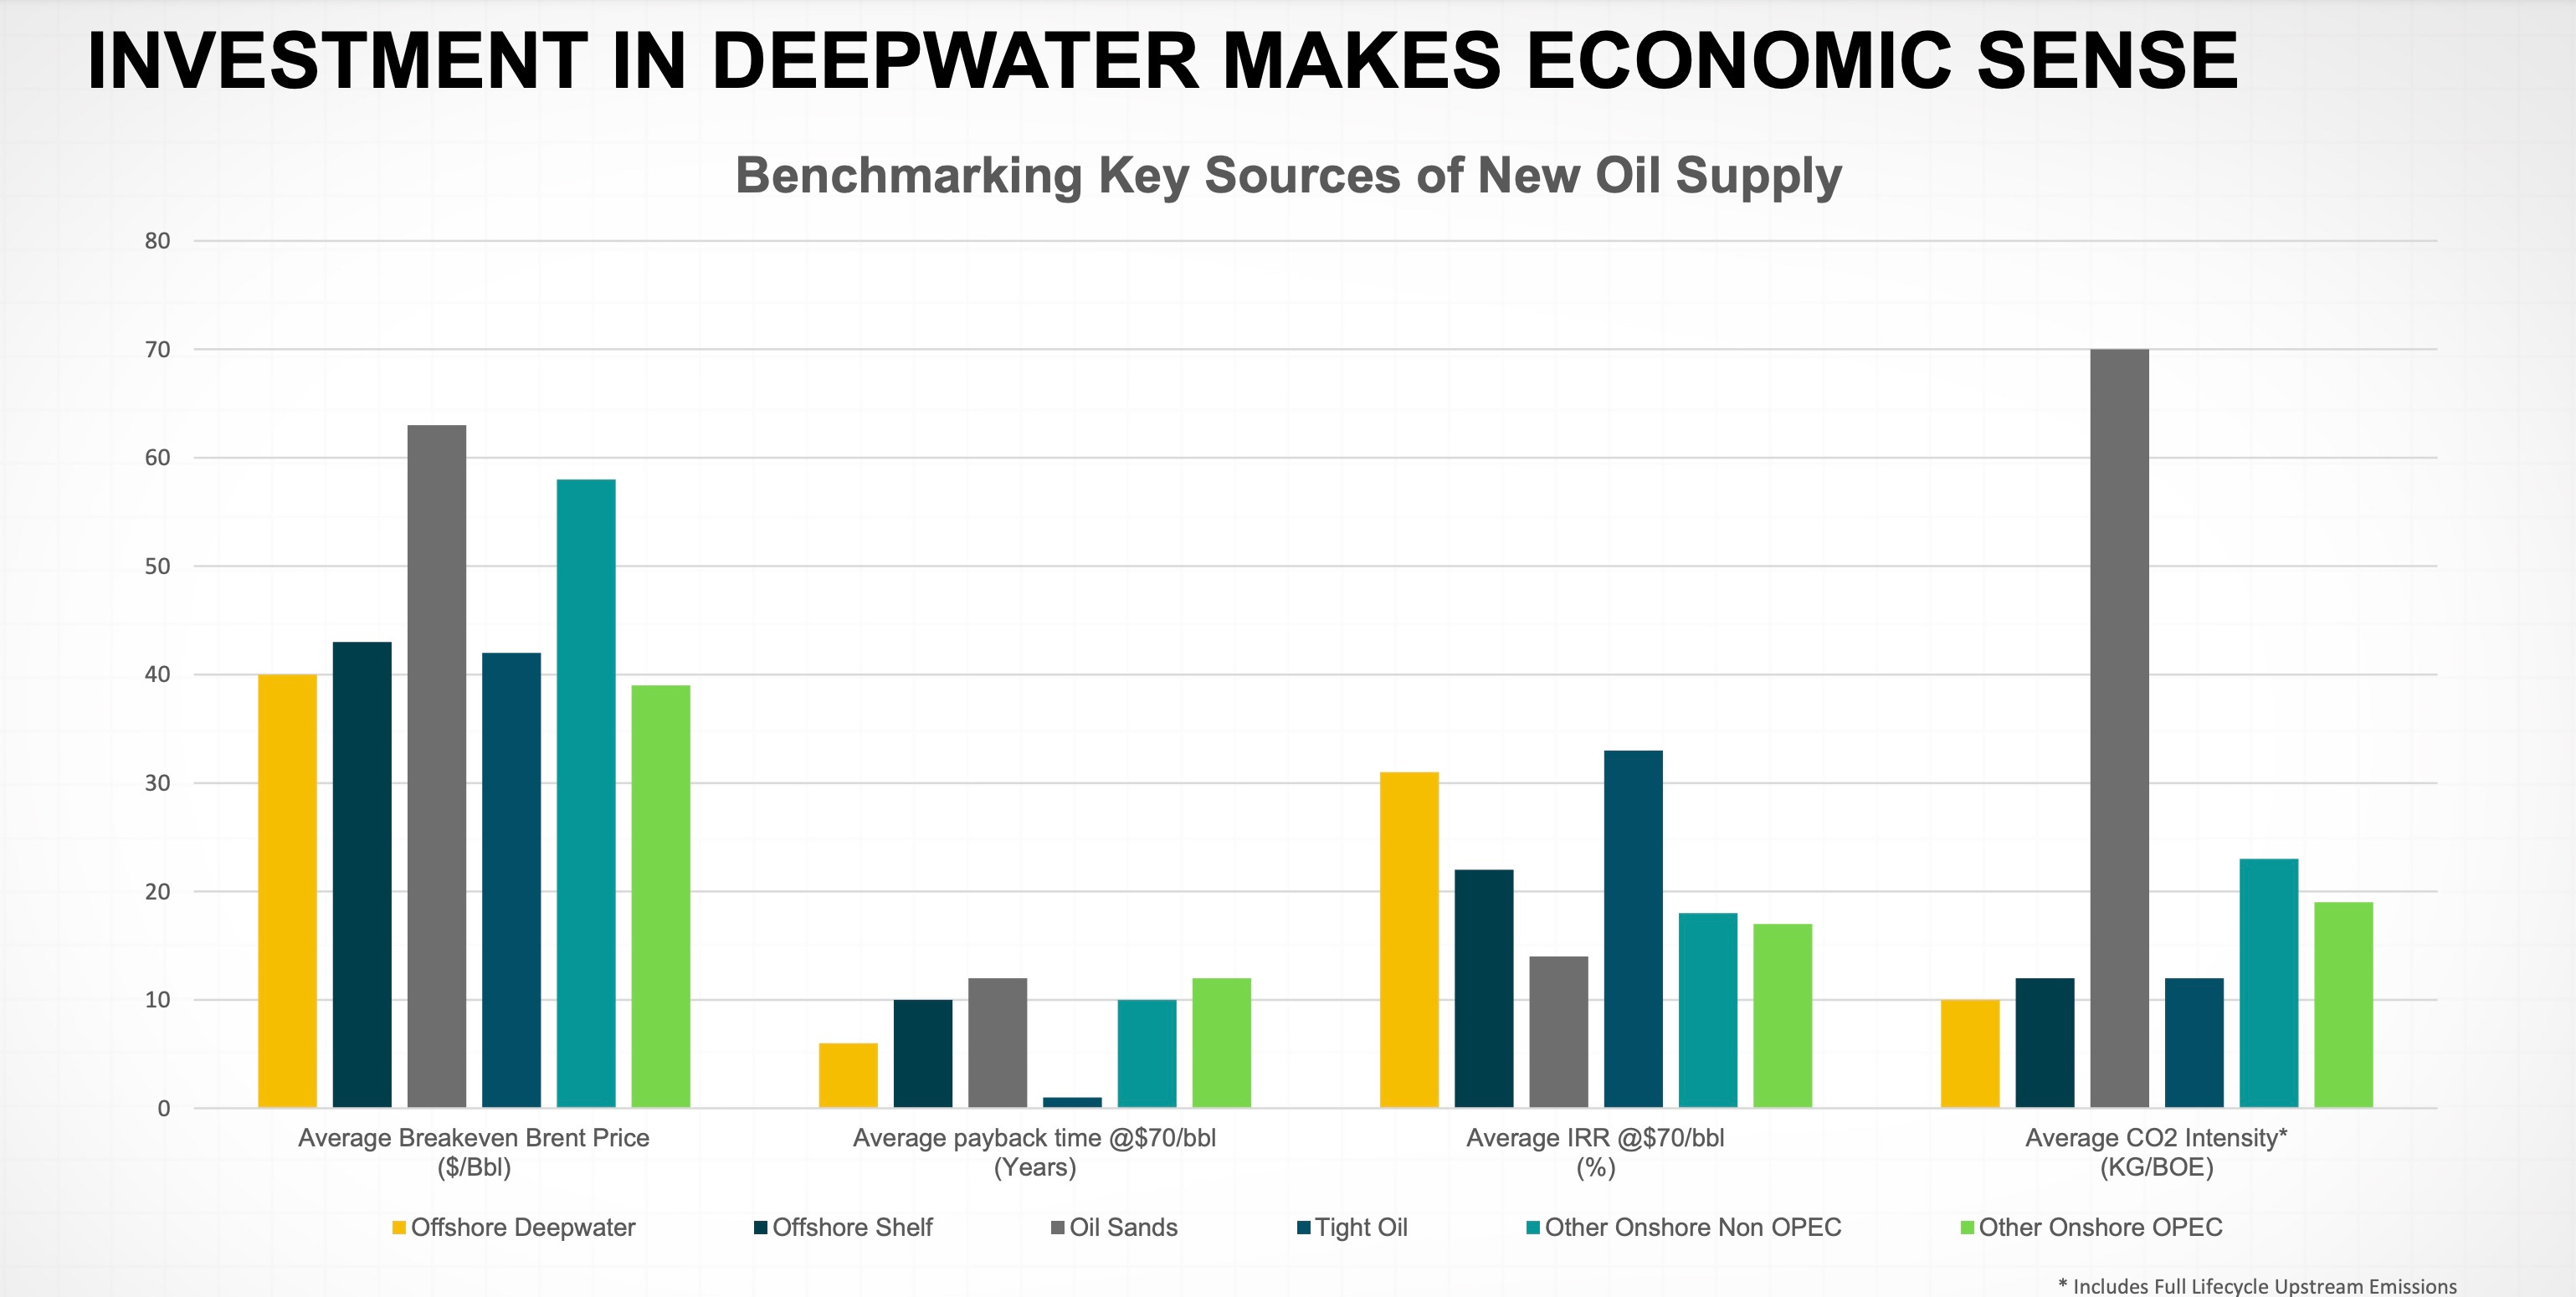
Lastly, offshore drilling has a much lower emission profile compared to onshore alternatives — about twice as low compared to conventional onshore and shale. While ESG concerns have been temporarily sidelined to meet growing energy demand, they still play a significant role, particuraly in Europe. Recent statements from Rystad Energy researchers have underlined this point:
“Offshore oil and gas production isn’t going anywhere, and the sector matters now possibly more than ever. As one of the lower carbon-intensive methods of extracting hydrocarbons, offshore operators and service companies should expect a windfall in the coming years as global superpowers try to reduce their carbon footprint while advancing the energy transition” - Audun Martinsen, Head of Supply Chain Research, Rystad Energy
Demand Picks Up
We see deman picking up with contracts values growing each year since 2021. According to IEA this is driven primarily by new projects in Guyana, Brazil, and the Middle East, according IEA. There are also numerous new explorations taking place in Namibia, India, and the Eastern Mediterranean. Additionally, we are witnessing infill drilling (additional drilling on more mature fields) in West Africa and Southeast Asia for clients like Valeura Energy.
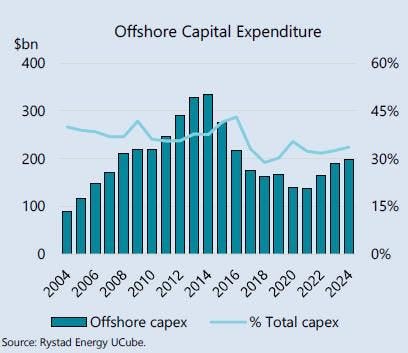
And, the money divereting to offshore. Since 2018, greenfield investments in offshore projects have surpassed those of onshore, initially by a small margin and now by approximately 50%. Greenfield investments are a strong indicator of the shifting paradigm in the industry.
The total investment spending has also surged, with greenfield, brownfield, and other projects showing rapid growth. Since 2021, offshore capital expenditures (capex) have increased from around $130bn to $200bn, reflecting a 54% increase and a compound annual growth rate (CAGR) of about 15%.
Rates Grow Again
The rising demand and limited available capacity have led to higher utilization rates of existing vessels. It's important to note that while there is a 2-3x increase in drilling volume per ship to offset the decline in fleet size, this is not a complete solution. Ships must still navigate across seas to reach drill sites, and their activities becoming more concentrated limits marginal flexibility (i.e., the ability to shift capacities to different contracts). As a result, clients alreadyc have to compete for resources, which is causing day rates to increase rapidly.
Since 2022, drillship day rates have surged from ~$250,000 to $500,000 — an impressive 100% increase over two years. Similar to oil fields, ships have varying specifications, and contract types differ significantly. That’s why there is a considerable disparity within the group. The most advanced 7th generation (7G) or 8th generation (8G) vessels command the highest day rates, while the 6G fleet, which is nearing Its obsolescence, tends to fill in at the lower end of the scale. Nevertheless, the overall trend remains highly positive for Valaris and the broader industry.

Since 2022, day rates for benign and harsh environment jackups have risen from ~$90,000 and ~$100,000 to ~$170,000 and ~$140,000, respectively — representing increases of roughly 90% and 40%. While this growth is not as significant as that of the drillship rates, it is still very high.

Where Will This Cycle Peak?
In the last cycle, day rates peaked at ~$800,000 for drillships, ~$225,000 for benign environment (BE) jackups, and ~$275,000 for harsh environment (HE) jackups. Considering the prevailing inflation during that period, the rising demand for energy amidst limited supply, and the shrinking number of drilling vessels, it is reasonable to expect these levels could be surpassed.
So, how high can we go? It's difficult to pinpoint exact figures, but we believe rates could reach ~$900,000 to ~$1,000,000 for drillships and ~$250,000 to ~$350,000 for jackups, depending on the type. That might be too conservative or optimistic depending on who you ask but we believe these figures are reasonable and, most importantly, directionally accurate.
Current Backlog
Since the end of 2022, Valaris's backlog has grown from $2.5bn to $4.3bn in 2Q24, before slightly retracing to $4.1bn in 3Q24. This, combined with slight dip in day rates in 2H24, has led some to speculate that the cycle has peaked. The drop in oil prices from $80/bbl to $70/bbl also has had a visible impact. Consequently, Valaris's stock has declined by nearly 50%, mirroring the downturn in the overall sector.

Despite this, with such strong tailwinds, a significant supply-demand imbalance, and healthy oil prices amidst growing energy demand, we maintain an optimistic outlook. We believe this steep decline in stock price presents a favorable opportunity to build a position.
What also instills confidence is the fact that notable value investors like Kuppy from Praetorian Capital and renowned shipping investor John Fredriksen are heavily investing in the stock. John has publicly disclosed the purchase of 724k shares in the second half of 2024, increasing his already substantial position to over 9% of the company. The Maersk family is also showing interest in the industry, acquiring 19% of Noble (~3mm shares). Furthermore, industry share buybacks have also accelerated, with companies repurchasing significant amounts of stock.
In the wave of offshore bankrupcies druing the last decade, Valaris also suffered. The company has seen new management come in, and it now carries almost no debt — though this has resulted in relatively low insider ownership of less than 1%.
Now, let’s explore what Valaris could be worth and the downside protection it offers.
Will Older Drillships become obsolete?
Historically, offshore vessels could operate for many decades. However, advancements in technology and the constant push for increased drilling depth, speed, and safety generally render them obsolete within 10-15 years.
We are currently witnessing the emergence of the 8th generation (8G) vessels, with only three 8Gs existing globally at this point. Under normal circumstances, the introduction of new 8G builds would eventually replace the older 7th generation fleet of 57 vessels. However, due to the current lack of new ship builds, this transition may be delayed.
In 4Q 2024 of the investor letter, Praetorian Capital suggests that for new 8G vessels to be constructed, the industry will likely need day rates of $1mm for drillships along with long-term contracts to justify such investments of well over $1bn per drillships. Given the current value proposition of the global fleet (moslty composed of 7G and 6G vessels) compared to other extraction methods, the prospects remain quite promising even without the most modern 8Gs.
Asset Valuation
Valaris is experiencing strong tailwinds and smart money buying, but what is the company's true worth? Currently, Valaris has a market capitalization of $3.4bn and net debt of $0.8bn, leading to an enterprise value (EV) of $4.2bn. What does this price represent? The company owns 12 high-spec 7G drillships, one more advanced 6G drillship, 5 semisubmersibles, and 35 jackups (nine of which are leased to a joint venture, with Valaris holding a 50% share). Additionally the company has a small support fleet.
According to our research, high-spec 7Gs could be priced at over $1bn if ordered today. Semisubmersibles vary in cost depending on their type but can be 10-35% cheaper; for our calculations, we assume $0.9mm per floater. Modern jackups are generally much cheaper, and purchasing them today would likely cost between $250mm and $300mm, so we will use a midpoint of $275mm. Additionally, we estimate the replacement cost of other support vessels at $90mm.
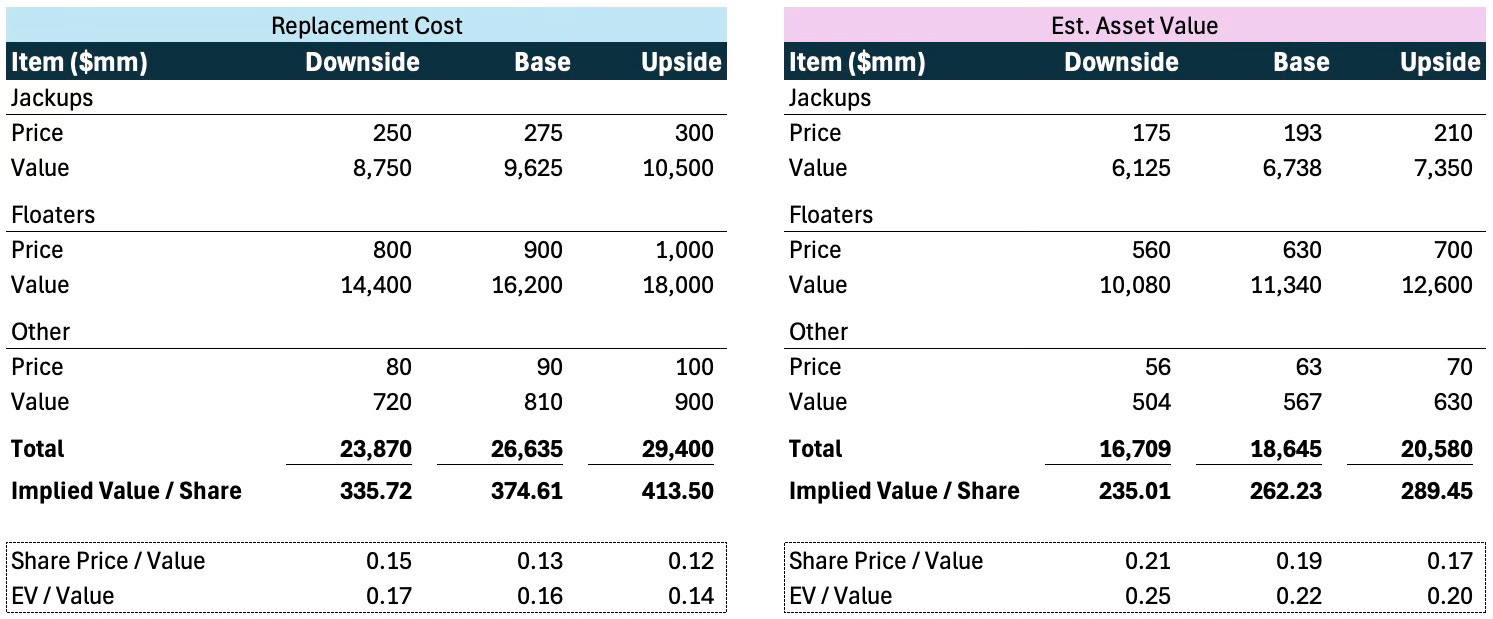
Based on these figures, the total replacement value of Valaris's fleet stands at ~$26.6bn, which is 6.3x its EV or 7.7x its market cap. This suggests that Valaris effectively trades at 16 cents on the dollar of its EV and 13 cents on the dollar of its market capitalization.
While this is based on replacement costs, it's important to recognize that the actual value of these assets may be somewhat lower due to wear and tear. However, the argument can be made that the extended waiting time to replace this assets (3+ years) with storng tailwinds would make the actual asset value ikely close to the replacement cost (at leas mid and peak cycle). Even assuming 30% discount to the replacement value, directionally nothing would change for VAL. Under this scenario, the company's assets could be valued at about 4.6x its EV and 5.3x its market cap.
Cyclical businesses typically trade on EV to net asset value (NAV) multiples. If we apply a multiple of 1.25x to 1.5x (the historical peak cycle) on the estimated asset value (30% discount to replacement value), we could see the company's EV range between $21bn and $36bn, implying potential upsides of ~5x to ~9x.

Due to the extreme cyclicality, NAV multiple is most likely the best way to put a target valuation on offshore. We Now, let’s now explore how cashflows can behave during the cycle.
Cash Flow Generation
Before moving on, once again we want to highlight that projecting actual day rates has almost 0% chance of accuracy. What matters is the overall direction and seeing the cash flow generation potential of the business.
As mentioned in the macro section, we believe that drillship rates could reach ~$900k to $1,000k, while jackup rates could range from ~$250k to ~$350k, depending on the type. For context, during the peak of the last cycle in 2014, rates reached ~$800k for drillships and between $225k and $275k for jackups.
In our model, we forecast that by 2028, rates could peak at around $900k for floaters (drillships and semisubs) and $275k for jackups.

Based on these prices and using mostly current metrics and ratios to forecast other items, we ended up with the following cash flow forecast.
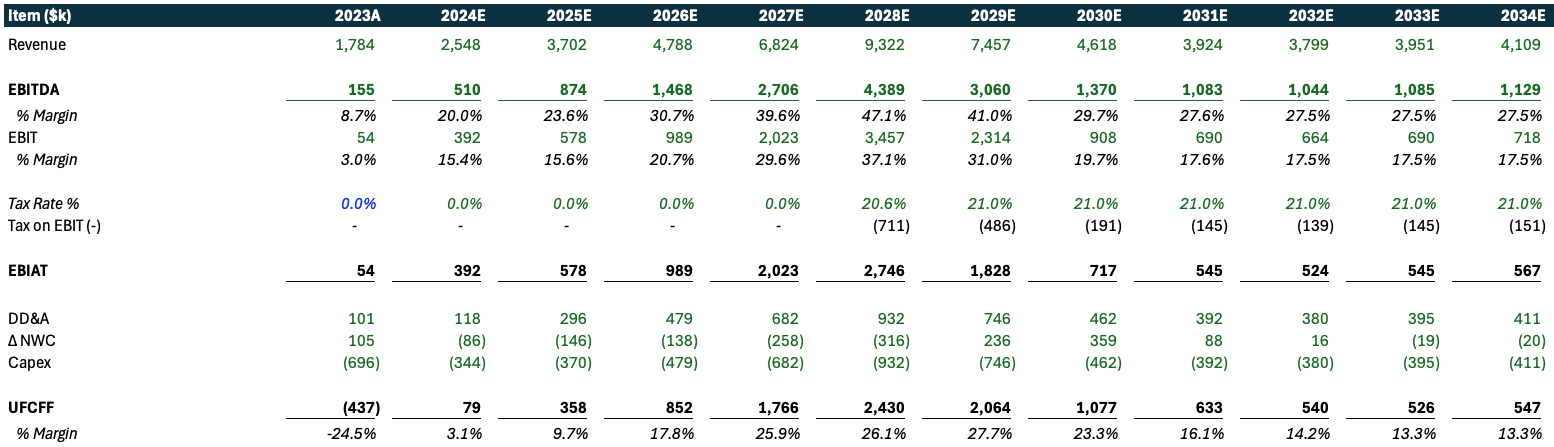
In analyzing Valaris's financial statements, we discovered that the company has accumulated significant net operating losses (NOLs) totaling around $0.9bn due to the downturn in the last decade. These NOLs could be utilized in the future to substantially reduce effective taxes and enhance cash flow generation.
Cyclical companies like Valaris typically exhibit significant operating leverage. With the anticipated increase in rates, we expect Valaris to expand its free cash flow margins from ~3% in 2024 to ~27% by 2028 (at the peak of the cycle). Combined with the growing revenue this would mean FCFF from $70mm in 2024E to $2,430mm peak cycle.
Below, we provide a sensitivity table illustrating how cash flow may vary in 2028 under different rate scenarios. Under all of these, the company represents a substantial upside potential.
Free Cash Flow Sensitivity to Drillship and Jackup Rates
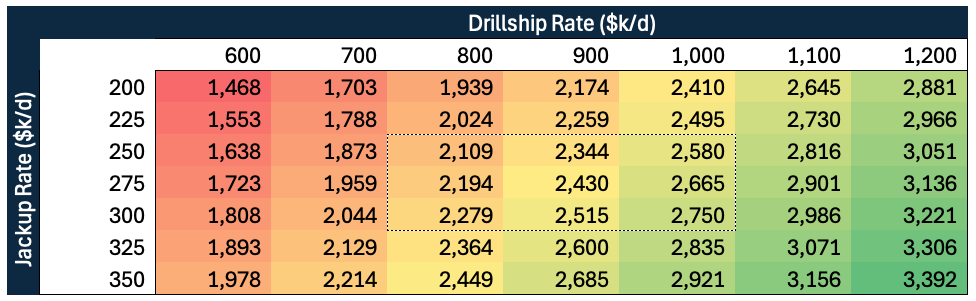
Trading at 16 cents on a dollar (replacement value), with extremely strong indsutry tailwinds and high operating leverege we think that Valaris could represent a great investment opportunity.
If you enjoyed this publication please subscribe, like, and comment! It would mean a great deal to us and help grow our research blog :)
We would love to post our analysis more often than those twice or thrice a month but due to our professional careers we don't have much time left for research. If you like what we do and want to support us in making this blog our primary source of income consider becoming a paid subscriber. We have special content and bnefits just for our paid supporters. That would mean a great deal to prioritize our research here :)
Disclaimer
The information contained on this website is not and should not be construed as investment advice and does not purport to be and does not express any opinion as to the price at which the securities of any company may trade at any time. The information and opinions provided herein should not be taken as specific advice on the merits of any investment decision. Investors should make their own decisions regarding the prospects of any company discussed herein based on such investors’ own review of publicly available information and should not rely on the information contained herein.
The information contained on this website has been prepared based on publicly available information and proprietary research. The author does not guarantee the accuracy or completeness of the information provided in this document. All statements and expressions herein are the sole opinion of the author and are subject to change without notice.
Any projections, market outlooks or estimates herein are forward looking statements and are based upon certain assumptions and should not be construed to be indicative of the actual events that will occur. Other events that were not taken into account may occur and may significantly affect the returns or performance of the securities discussed herein. Except where otherwise indicated, the information provided herein is based on matters as they exist as of the date of preparation and not as of any future date, and the author undertakes no obligation to correct, update or revise the information in this document or to otherwise provide any additional materials.
The author, the author’s affiliates, and clients of the author’s affiliates may currently have long or short positions in the securities of certain of the companies mentioned herein, or may have such a position in the future (and therefore may profit from fluctuations in the trading price of the securities). to the extent such persons do have such positions, there is no guarantee that such persons will maintain such positions.
Neither the author nor any of its affiliates accepts any liability whatsoever for any direct or consequential loss howsoever arising, directly or indirectly, from any use of the information contained herein. In addition, nothing presented herein shall constitute an offer to sell or the solicitation of any offer to buy any security.
External links, if any, may redirect you to a privately-owned web page or site (“site”) created, operated, and maintained by a third party, which may not be affiliated with Alpha Ark. The views and opinions expressed on the site, other than those presented by Alpha Ark, are solely those of the author of the site and should not be attributed to Alpha Ark. We have not verified the information and opinions found on the site, nor do we make any representations as to its accuracy and completeness as to the third-party information. Further, Alpha Ark does not endorse any of the third-party’s products and services or its privacy and security policies, which may differ from ours. We recommend that you review the third-party’s policies, terms, and conditions to fully understand what information may be collected and maintained as a result of your visit to this website.
This is great, especially the market section! I've been holding Valaris throughout the correction in the second half of the year, and I bought some more recently. Imho, this was a huge overreaction.